

Flux Analysis
Compare financial figures across periods, identify significant movements, and draft explanations and follow-up questions for your review.
01 / 04
Attach comparative financial information
02 / 04
Review absolute and percentage movements
03 / 04
Separate reported facts from possible causes
04 / 04
Identify evidence and follow-up questions
This live Analyse Financials demonstration compares fictional Northstar financial statements for FY2024 and FY2025. The saved review highlights changes in revenue, margins and expenses, then identifies supporting evidence and questions for the accountant to investigate.
Synthetic demonstration data
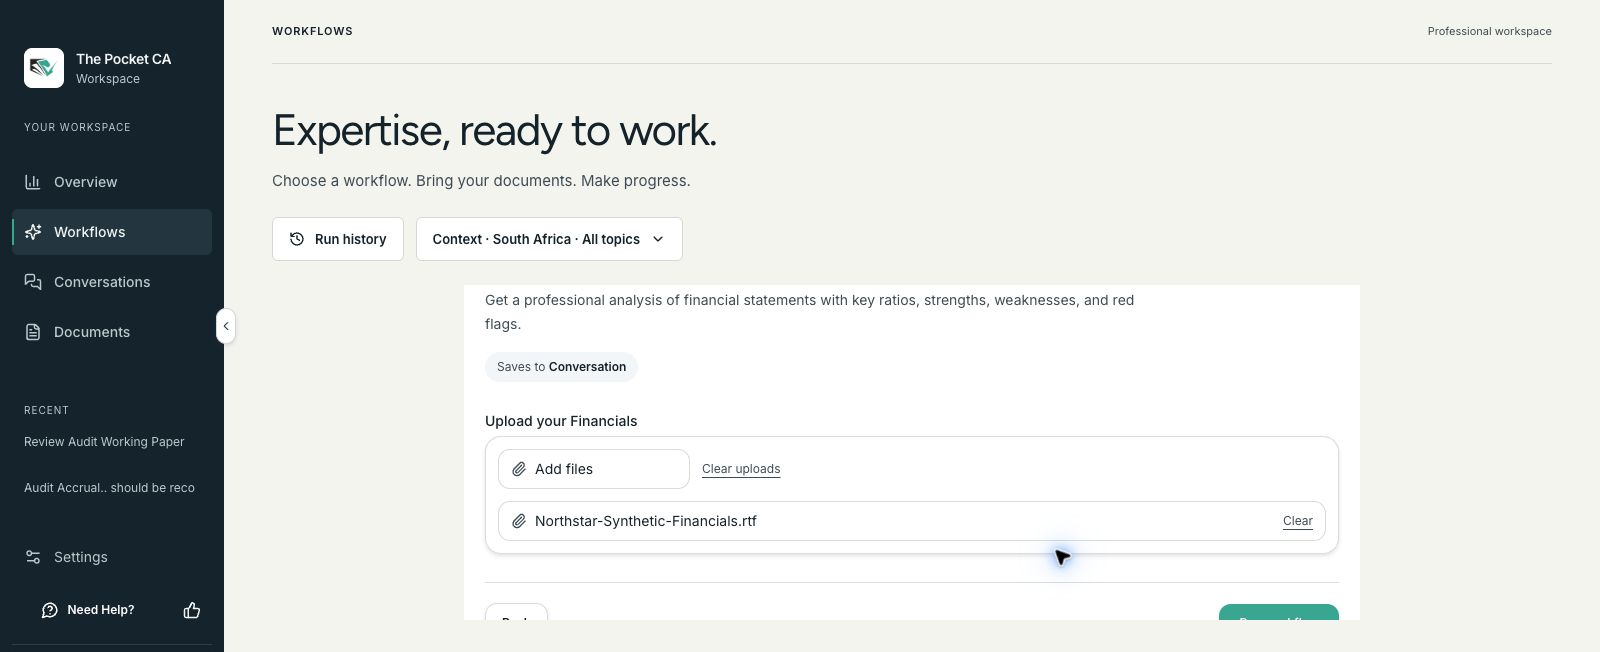
01 Attach the fictional comparative financial statements to the Analyse Financials workflow.

02 Compare FY2024 with FY2025. The saved flux table distinguishes the revenue movement from management’s unverified explanation.

03 Inspect employee and marketing movements in detail, the evidence still needed, and the gross-margin conclusion.
In this synthetic example, revenue increases by R400,000 (20%) while cost of sales increases by R280,000 (35%). Gross margin falls from 60% to 55%: a decrease of five percentage points. Employee costs rise 30% and marketing doubles. Management explanations require supporting evidence. These are example findings, not performance claims.
Check source figures and reporting periods, corroborate management explanations, investigate unresolved movements and decide what action to take.